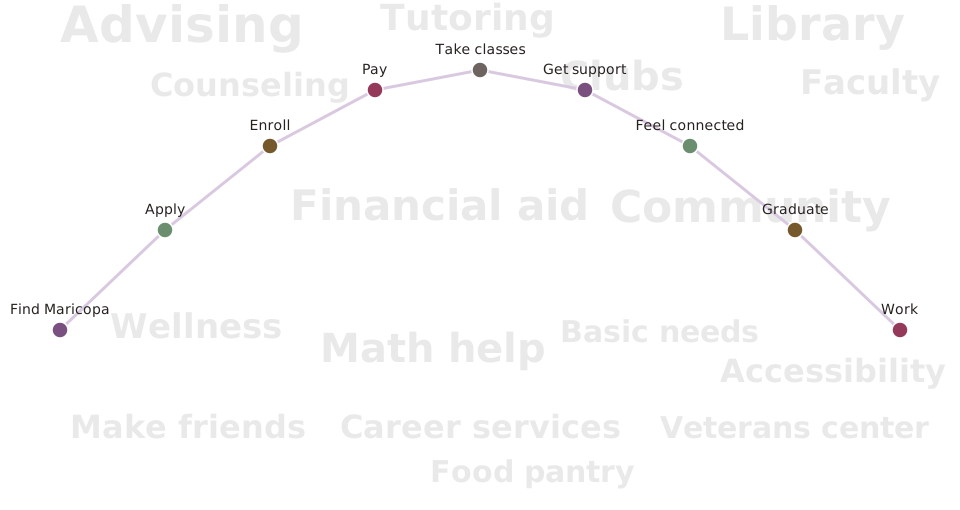
Community college students leave at high rates, and the reasons are rarely academic. They get worn down by the systems around their classes: logins that fail, an enrollment that runs twenty steps instead of eight, dead-end pages, and support that exists on every campus but hides behind the wrong name. This is an AI initiative, Domain 5 of the district’s AI committee (the ARC), that studies those barriers across the full student journey at all 10 Maricopa colleges and turns each one into a concrete, human-centered way for AI to clear it, every option screened against a hard no-student-data line. It is run as rigorous UX research, cognitive walkthroughs, heuristic evaluation, Nielsen severity rating, journey mapping, with an AI agent as the research instrument, and it is already underway: the first pilot findings are live below.
The diagnosis, the study itself, is built to land over the summer so the fall is free to build and pilot the actual fixes. One dependency sets that order: the district’s new CRM platform is not in production until fall, so evaluating its AI capability, which could resolve a number of the barriers we are finding, is the last piece of the puzzle.
The method is not just described, it is running. As the pilot proof of concept, an AI agent walked the public websites of Glendale and Mesa Community Colleges as a brand-new student, six common tasks each, and logged exactly where a student would give up, with a severity rating and an agent-readiness note per task. It already surfaces the patterns the full study will measure: the same service named differently at each college, help that exists but hides behind the wrong label, and answers trapped in PDFs and unlabeled links. Public pages only for now; authenticated depth and all 10 colleges come in the fall.
The pilot walkthrough was performed by an AI agent, and the AI drafted most of the writing on this site. That is the point: the study uses AI as the research instrument, not just the subject. It also means the findings are preliminary. Severity ratings, service names, and figures are first-pass results that a human still has to verify, and the fieldwork phase is where that verification happens. Read the barrier findings as leads to confirm, not settled facts.
Fewer than six in ten community college students return for a second year at the same institution, and part-time students, the community college majority, persist to a second fall at only 53 percent. When students are asked directly why they leave, the answer is almost never ability. It is the pressure of adult life colliding with an institution that assumes students will come find it. The community college population carries those pressures more heavily than any other group in higher education.
A 2025 GCC faculty and staff survey put a local face on the national pattern. It logged 83 student barriers, rated 4.5 out of 5 on both frustration and impact, and the biggest categories were not classroom problems. They were student access, communication, and reaching the right service. Sorted by who owns the fix, the most-named offices were IT, Advising, and Basic Needs. One survey does not prove a district, but it lines up with the national research almost exactly.
The services that could relieve these pressures exist on every campus, but a student working two jobs and caring for a parent does not have time to work out which office to call, and often does not recognize their own situation as something a service was built for. A student with ADHD may not know Disability Resources is there for them. A first-generation student falling behind may not know advising is available at all. Only 55 percent of students say their college communicates support well. The gap between leaving and staying is most often a gap in awareness and connection, not in whether the service exists. That gap is closable, and closing it is what this work is for.
The full evidence base, with every source and the local GCC barrier data, is linked in the working materials at the bottom of this page.
Domain 5 of the district’s AI committee (the ARC) is not here to fix every barrier students face. Many of the things that hurt persistence are process or policy problems, and the ones with no AI component are not ours to solve. Our mandate is narrow on purpose: pinpoint where AI can close the gaps that drive students away, above all the support and connection that already exist on every campus but that students cannot find when they need it. Barriers that turn out to be non-AI problems get documented and routed to the owner who can act on them. The AI opportunities are what we carry forward.
One of the clearest opportunities is taking the routine, repetitive load off the people who do student support. When a student asks where the FAFSA deadline is, whether a class is still open, or what their balance is, an advisor or a financial-aid specialist has to stop and answer the same simple question again, or send the “we will get back to you in a few days” email just to book a slot. If the easy, factual questions are answered the moment a student asks them, and only the situations that genuinely need a person reach a person, that delay email mostly goes away. Staff spend less time on triage and routing and more on the individual problems and the human connection that only they can do, the work they came into this field for. No one is replaced. The aim is to give the people in these offices their time back and let the technology carry the busywork.
One clarification that matters: a faculty member who checks in on a struggling student or points them to a resource outside the classroom is doing student-support work, and that is in our lane. The question is not who connects, but whether the connection happens outside the instructional relationship.
You cannot fix what you cannot see, and you only see it from the student’s side. An application a college believes is an 8-step process can prove to be a 30-step experience once someone walks it end to end. So the work is built as a UX study, not a survey. Three research personas live the full journey, from application to the goal they came for, and they are given problems, never destinations. We never tell a persona where to go. They receive a real felt need, “I am failing math,” “I need to register,” and must navigate the live systems themselves while thinking aloud. The gap between self-serving and giving up to call a human is the barrier data.
Each persona is run at every one of the 10 colleges, so the study produces 30 distinct journeys, not three, and each run covers every service the inventory identified, financial aid, advising, registration, tutoring, basic needs, and the rest, college by college. At more than 60 touchpoints per run, that is a college-by-college matrix of exactly where students hit barriers, how severe each one is, and, just as important, where support that exists is going unfound.
The study is run and analyzed in Notion (research repository, tagging, and synthesis), FigJam (journey maps and service blueprints), and Miro (collaborative workshops and affinity sessions). Personas are stress-tested test profiles, pending validation with real students. No student PII is collected. The full personas, the 10-stage journey, the tester run sheet, and the capture instrument are in the working materials below.
This Phase 1 work captures a “before” number so we can prove whether the AI tools and processes actually move the needle. For each service, disability resources, tutoring, the library, advising, and the rest, we record how many students use it today, paired with each college’s total enrollment. Institutional Research does not hold the per-service usage counts, so those come from the departments themselves, which is already built into the fieldwork intake. Enrollment numbers are public (IPEDS and the college fact books). Then, about a year after the AI tools launch, we re-take the same measures to see whether more students are reaching these services. It is a pre/post impact evaluation, and it stays inside the no-student-data line: counts and aggregates only, never any PII.
A handful of student testers could never walk 30 full journeys across 60-plus touchpoints each. The differentiator here is method: the walkthroughs are run as AI-agent-assisted sessions. A researcher authenticates and directs each run. An AI agent drives and records the journey, click by click, capturing the path taken, the time, and the dead ends at a scale no small team could reach. The researcher then rates the severity of each barrier and confirms the finding. Real-student think-aloud sessions validate the personas and the top findings, so the human signal anchors the scaled data.
The researcher is the only one who ever logs in, using her own student account, which holds no enrolled coursework and no FERPA-protected data. To walk registration, she enrolls in a test section and drops it before any charge posts. The AI agent is never given credentials and never reads student data; it drives the public and authenticated flows the researcher has opened, and records the experience. The protocol is reviewed by governance before any fieldwork begins. No student-level data is touched at any point.
There is a second lens built into the same pass. Every service is scored twice. Once for human usability, the way any UX study would. And once for agent-readiness: could a student’s own AI assistant find the service, read it, and act on it? This applies the emerging discipline of Agent Experience (AX), the practice of designing for the AI agents that increasingly act on a user’s behalf (Lamenza, “What is AX Design? Why do we need this new role” (2026)). As students arrive with their own AI assistants, a service that an agent cannot parse is a service those students effectively cannot reach. Almost no one in higher education is measuring this yet. Scoring it now is how the district gets ahead of it.
A page can be perfectly usable for a person and invisible to an agent, or the reverse. Measuring both turns the study into a forward-looking map: where students hit walls today, and where their AI assistants will hit walls tomorrow.
Every documented barrier maps to a proposed, human-centered AI fix, and the fixes are ranked by one question first: how many students would this actually reach? A sophisticated tool that touches 200 students matters less than a simple one that reaches 20,000. After reach come barrier severity from the study and extra weight for the populations the evidence shows are most at risk of leaving. An “AI fix” is not necessarily a new app. It can be an agent, a bot, a tool the district builds, or something it buys or adds on, such as a vendor connector to a platform we already run. For each barrier we pick the lightest thing that works.
Across all of them the shape is the same, and it is the guardrail: AI surfaces the right student or the right resource, and a human follows through. A tool should answer the simple factual questions on its own, where is my class, when is the FAFSA deadline, what is my balance, and route the questions that need a person to a person. The measure of success is more human contact where it matters, not less. The models this aims at, Georgia State’s Pounce, CUNY ASAP, Caring Campus, and GCC’s own Peer Success Coaches, all pair technology that surfaces the right student with a human who follows through.
This is the governance principle the whole list is filtered through. No PII, full stop. There is a real precedent inside the district: it uses a major CRM for some student touchpoints, but declined that vendor’s AI add-on because it would collect student data. The data-sovereign answer is to build an equivalent that delivers the same help without harvesting student data, the same no-PII model already behind the district’s home-grown student tools. When the choice is between buying a tool that collects and building one that does not, we prefer build-without-collecting.
An equivalent capability built on the district’s own no-PII model: first-name or anonymous, localStorage, aggregates only. Delivers the help, harvests nothing. The model behind the district’s existing home-grown student tools.
A vendor AI add-on that delivers the same help but collects student data to do it. Declined in practice already, on exactly these grounds. Buy is fine when a connector adds no data exposure; it is not fine when help is purchased at the cost of student data.
Two high-reach directions are already clear from the barrier data. First, put the help everywhere the student already is, in Canvas, at enrollment, in the financial-aid flow, in a Discord channel, so a student does not have to know the name of the office that provides it. CopaMigo, a bilingual plain-language routing prototype I built, is an early proof of concept for this: a student describes their situation in plain language and gets a direct answer when the question is simple, or a route to the right human service when it is not. Second, equip faculty as the first line of support, since they notice a struggling student first, with a short briefing on why an absence is a signal to connect rather than to cut. The full ranked list comes out of the study; the prioritization logic and the proven models are in the recommendations below.
CopaMigo is an early prototype I built, not a production tool, and one example of the build option among several. The full prioritization method, the proven models, and the build-adopt-configure logic are in the recommendations page in the working materials.
Everything above is the case study. Below are the working tools behind it: the full inventories, the study instruments, the evidence base, and the recommendations. They are the appendix, not the main path. Open any one to go deeper.
The first real run of the method: an AI agent walked the public sites of two colleges as a new student, six tasks each, with a severity rating and an agent-readiness note per task. Real barriers, not a description of barriers.
The inventory of student-facing services across all 10 colleges, and how the usage baseline is gathered. The before-number we measure AI improvements against.
The crosswalk framework: every function across all 10 colleges, mapped to each college’s local name. A first-draft grid being populated and verified college by college, not yet a finished or authoritative dataset.
The three personas, the 10-stage journey, the methods, and how a tester runs a session. The full diagnosis.
The scaled study moves from three personas to 36, reflecting the real demographics across the ten colleges. Every test is one persona, one campus, one task.
46 base tasks across the whole journey, multiplied by persona and by the ten colleges toward 500 scenarios and 5,000 task-runs, split between human and AI testers. A spreadsheet with status, tester, and severity fields.
One screen for what is tested versus not across the ten colleges and the journey stages, plus the worst barriers found. Populates from the scenario-bank tracking sheet.
The scaled study end to end for the steering committee: the persona-per-test model, the path to 5,000 runs, the human and AI split, operations and tracking, the tool stack, and what we need to proceed.
The one-page sheet a tester reads before a session: persona, test login, college, and the task list in order, plus the capture form they record into.
How the crosswalk and usage baseline get gathered with a short two-field intake, an async subcommittee plan for a committee that rarely meets, and a ready-to-send letter for college service owners.
The full evidence base: the national data on non-persistence and GCC’s own barrier survey, with every source linked.
The full GCC Student Frustrations Survey: all 83 documented barriers, sorted by type and by the department that owns the fix.
How barriers become ranked AI pilots: the prioritization logic, the proven models, the build-adopt-configure choice, and the implementation pressures we plan for.
A short evidence brief on student persistence, prepared for faculty and academic leadership: who your students actually are, and why an absence is a signal to connect.