Applied Data Science
Course Design · Case study
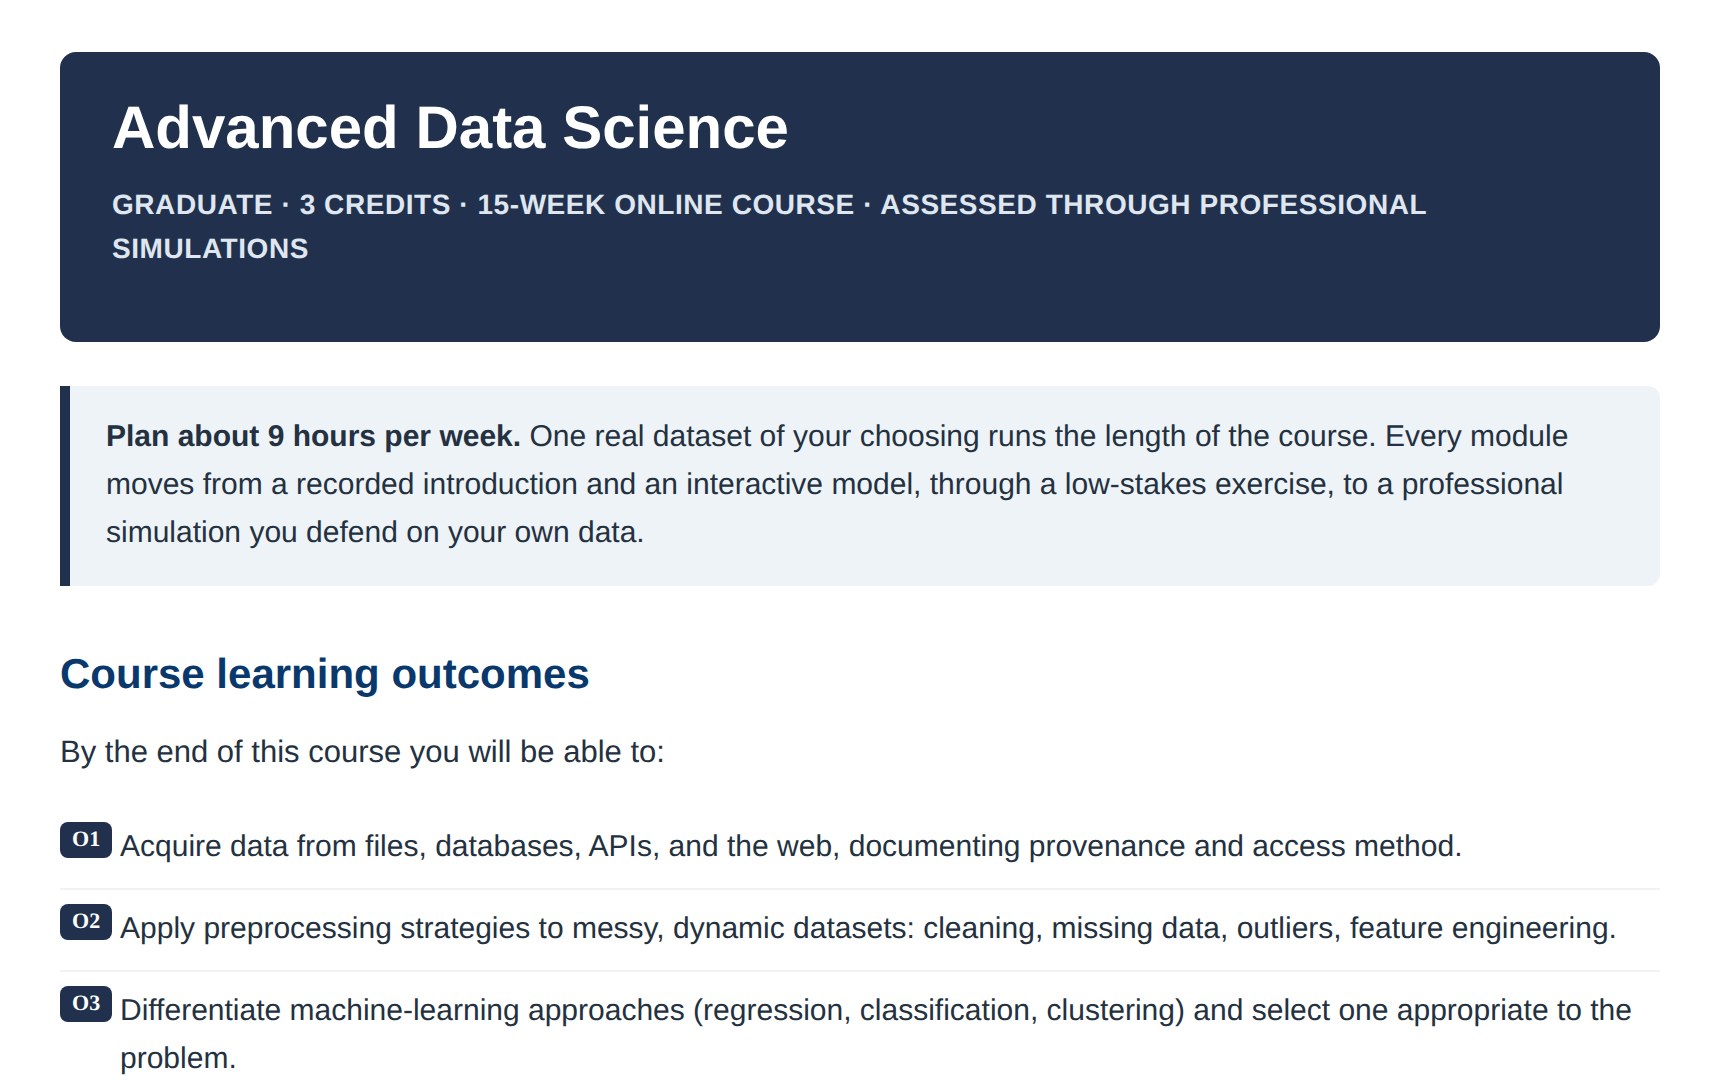
An experiment: a graduate data science course built with no subject-matter expert, then reviewed by one. I designed a professional simulation for every module and built four of them as playable tools, on top of vetted open readings and interactive models. Assessed by performance, not exams.
Goal
Applied Data Science tests whether the synthetic-SME method can produce a rigorous graduate course in a field the designer does not teach, so the quality has to come from the design rather than from subject-matter command. It is a full 15-week, three-credit, MS-level course, combining original simulations I designed for every assessment with vetted open educational resources for its readings and models.
Audience
The learners are graduate, MS-level data-science students. As a portfolio piece, the page is written for learning designers and academic leaders judging whether AI-assisted course production can hold to real quality standards.
Process
The course is designed backward, outcomes first, then the evidence, then instruction. A panel of AI agents drafted each module against a fixed checklist of online-quality standards; I directed the panel and own every decision.
How success is measured
Success is a performance, not a test score. Each of the eight modules ends in a summative simulation of a real professional task, engineered so a generative model cannot complete it for the student. The Simulations tab covers how. This is authentic, performance-based assessment (Wiggins): competence is inferred from what a student does with a real, private artifact, which preserves construct validity where a conventional exam no longer can.
Pacing and interaction
Every module follows the same rhythm, so the structure never becomes the obstacle (cognitive load theory, Sweller). The course is sized to the credit-hour standard the Higher Learning Commission applies (34 CFR 600.2), 135 hours of student work across 15 weeks, about nine hours a week, with an estimated-time note on every task to support planning and self-regulated learning (Zimmerman). Instructor presence is designed in from a Getting Started module and a weekly, instructor-initiated interaction plan, building the teaching presence a Community of Inquiry depends on (Garrison, Anderson & Archer).
The learning arc, week by week:
| Weeks | Module and focus | Summative simulation |
|---|---|---|
| 1–2 | M1 · Acquisition and the reproducible workflow | The Provenance Incident |
| 3–4 | M2 · Preprocessing messy and dynamic data | Recover the Signal |
| 5–6 | M3 · EDA, visualization and the stakeholder story | The 10-Minute Executive Brief |
| 7–8 | M4 · Supervised learning | Private-Leaderboard Competition |
| 9–10 | M5 · Rigorous evaluation | Ridgeline Renewables model audit |
| 11 | M6 · Unsupervised learning | How Many Segments, Really? |
| 12 | M7 · Data and AI ethics and governance | The Model-Governance Review Board |
| 13–15 | M8 · Capstone consulting engagement | The RiverCity Engagement + live defense |
Access
Universal Design for Learning (CAST) and WCAG 2.1 AA are built into the design rather than audited on afterward. All three UDL principles are addressed: multiple means of engagement, of representation (recorded introductions, readings, and interactive explorables), and of action and expression (the simulations and defended project let students demonstrate mastery in more than one way). Videos are captioned with slide alternatives, and time-on-task is signaled in words and a bold label, not styling alone (WCAG 1.3.1). The Getting Started module orients every learner to the online environment before content begins.
Technology
- Build and orchestration. A reusable Claude skill (the Gemini equivalent is a Gem) orchestrates the agent panel. Built with the synthetic-SME method (AI-assisted course design →).
- Design frameworks. Backward design (Wiggins & McTighe), constructive alignment (Biggs), and the revised Bloom’s taxonomy for outcome verbs.
- Quality and compliance standards, enforced on every pass. OSCQR, Regular and Substantive Interaction (34 CFR 600.2), Universal Design for Learning (CAST), and WCAG 2.1 AA.
- Open educational resources and explorables I found and license-verified. MLU-Explain, TensorFlow Playground, R2D3, Setosa, Distill, Seeing Theory, Facets, Data-to-Viz, the FT Visual Vocabulary, StatKey, Kaggle Data Cleaning, missingno, Select Star SQL, and Google’s PAIR fairness tools, Aequitas, and the What-If Tool.
- Simulations I built for this course. All eight professional simulations are my own designs, one per module. Four of them (modules 5 to 8) are built as playable interactive simulations, and I released those as open educational resources under a Creative Commons license. Made with Synthetic Data Vault and Faker for per-student seeded datasets, Evidently for data-drift detection, and Docker for reproducible environments.
- Course-grounded AI tutor. A public Gemini Notebook that answers only from the course and its vetted sources, with citations.
- Language and delivery. Python throughout; the course itself delivered as static HTML and CSS.
- Instructor materials. Eight slide decks with speaker-note scripts and a full instructor preparation kit.
Outcomes
Reviewed, but not yet verified by the faculty member who would teach it, not tested with students, and not delivered to students.
This course was an experiment: how far does AI get when no subject-matter expert is in the room? I do not recommend building a course that way. After it was built, a business and data analyst with an M.S. in applied statistics and data science reviewed it.
| Review question | What she found |
|---|---|
| How much is usable? | Her estimate: about 78 percent as built, with targeted revisions and a final check by a faculty subject-matter expert. |
| What held up? | Clear outcomes, a logical sequence of modules, and the simulations, seeded datasets and live defenses, because students have to show their own reasoning. |
| What would she change? | The title promised more than the content. Call it applied data science, or add advanced topics: time series, deep learning, natural language processing, causal inference, scalable computing and machine learning operations. The course is now titled Applied Data Science. |
| What should be tested first? | Workload, the seeded assessments, grading consistency and accessibility, with a small group of students. |
Where this is useful: as a starting point when an expert is not available yet. A faculty member handed a course on short notice, with nothing in place, gets a reviewed draft to correct instead of a blank shell. The expert still finishes it.
Adopt this course
Download the whole course as a Common Cartridge and import it into Canvas, Blackboard, Moodle, or D2L (in Canvas: Settings, then Import Course Content, then Common Cartridge). It brings in a Start Here page, the Getting Started module, and all eight modules as pages, with the four simulations and the defense tool linked, and an editable PowerPoint lecture deck bundled inside each module. Free to reuse and adapt for noncommercial purposes under the license below.
This course is an open educational resource by Michelle Blomberg, released under CC BY-NC-SA 4.0. Reuse, adapt, and share for noncommercial purposes with attribution, under the same license. To credit it, use: “Applied Data Science by Michelle Blomberg, licensed under CC BY-NC-SA 4.0.”